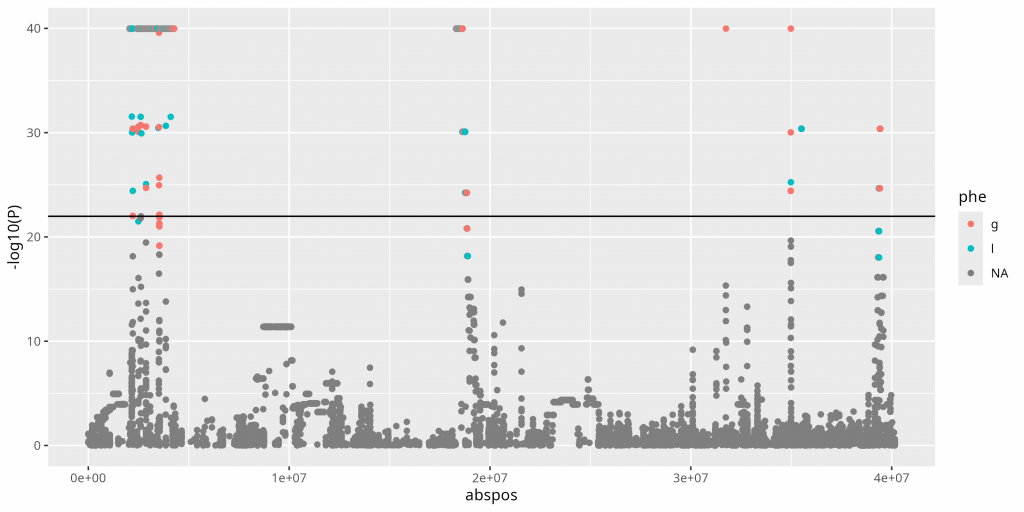
Preliminary GWAS Results
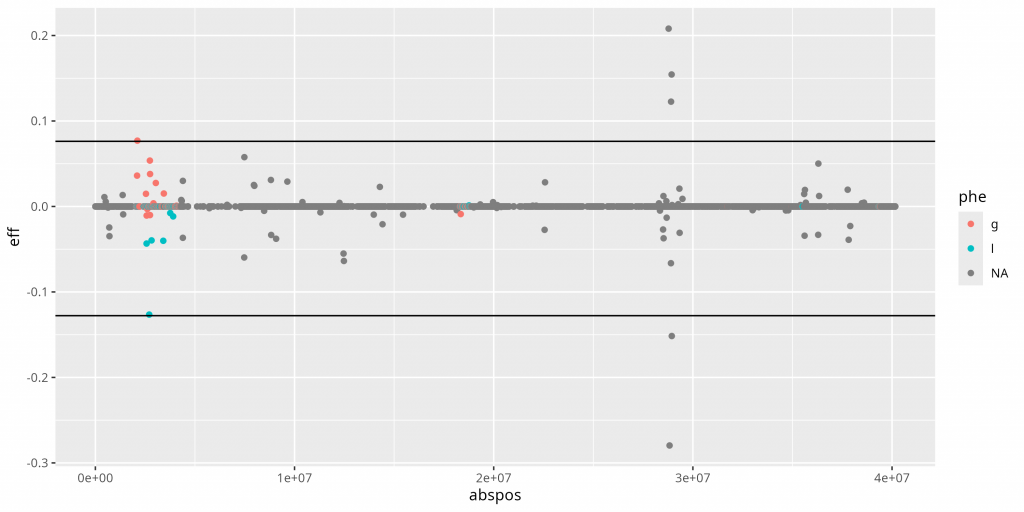
BSLMM: Associated Genes
The Bayesian sparse linear mixed model produced the smallest number of significantly associated genes, mostly from the same regions identified by the linear model. This short list of genes includes ones involved in carbon metabolism and protein synthesis.
| PCA Correlation | SNP ID | SNP Scaff. | SNP Pos. | Effect | Downstream Gene Scaff. | Downstream Gene Type | Downstream Gene Start | Downstream Gene Stop | Downstream Gene Strand | Downstream Gene Phase | Downstream Gene ID | Downstream Gene Name | Upstream Gene Scaff. | Upstream Gene Type | Upstream Gene Start | Upstream Gene Stop | Upstream Gene Strand | Upstream Gene Phase | Upstream Gene ID | Upstream Gene Name |
|---|---|---|---|---|---|---|---|---|---|---|---|---|---|---|---|---|---|---|---|---|
| aga | Chr1047:20020\T,\C | 5 | 20020 | -0.01993098 | 5 | gene | 18386 | 20564 | + | rna-gnl|WGS:QKKD|L226DRAFT_mRNA480625 | mannanase | |||||||||
| aga | Chr1047:362588\A,\G | 5 | 362588 | -0.0141599863274 | 5 | gene | 362276 | 364189 | – | rna-gnl|WGS:QKKD|L226DRAFT_mRNA456986 | homoserine O-acetyltransferase | |||||||||
| aga | Chr1047:779150\T,\G | 5 | 779150 | -0.02569876 | 5 | gene | 778480 | 779139 | – | rna-gnl|WGS:QKKD|L226DRAFT_mRNA289929 | hypothetical protein | 5 | gene | 779329 | 781713 | – | rna-gnl|WGS:QKKD|L226DRAFT_mRNA610287 | hypothetical protein | ||
| aga | Chr1047:837099\G,\A | 5 | 837099 | -0.02058652 | 5 | gene | 835929 | 838479 | + | rna-gnl|WGS:QKKD|L226DRAFT_mRNA531717 | hypothetical protein | |||||||||
| aga | Chr1047:959366\G,\A | 5 | 959366 | -0.0183342358056 | 5 | gene | 956932 | 959245 | + | rna-gnl|WGS:QKKD|L226DRAFT_mRNA610344 | hypothetical protein | |||||||||
| aga | Chr1047:1082394\A,\G | 5 | 1082394 | -0.02622976 | 5 | gene | 1082045 | 1083561 | – | rna-gnl|WGS:QKKD|L226DRAFT_mRNA551180 | phosphopantothenate-cysteine ligase | |||||||||
| aga | Chr1047:1134386\A,\G | 5 | 1134386 | -0.01627176 | 5 | gene | 1134353 | 1135371 | + | rna-gnl|WGS:QKKD|L226DRAFT_mRNA531833 | hypothetical protein | |||||||||
| aga | Chr1047:1167402\T,\C | 5 | 1167402 | -0.0193230869364 | 5 | gene | 1163998 | 1167020 | – | rna-gnl|WGS:QKKD|L226DRAFT_mRNA531846 | hypothetical protein | 5 | gene | 1167451 | 1168064 | + | rna-gnl|WGS:QKKD|L226DRAFT_mRNA457574 | UPF0041-domain-containing protein | ||
| aga | Chr1047:1317050\A,\C | 5 | 1317050 | -0.02262773 | 5 | gene | 1316530 | 1317709 | – | rna-gnl|WGS:QKKD|L226DRAFT_mRNA568174 | hypothetical protein | |||||||||
| aga | Chr1047:1350097\T,\C | 5 | 1350097 | -0.01868771 | ||||||||||||||||
| aga | Chr1047:1423286\G,\T | 5 | 1423286 | -0.02649434 | 5 | gene | 1420120 | 1423186 | – | rna-gnl|WGS:QKKD|L226DRAFT_mRNA610474 | hypothetical protein | 5 | gene | 1423453 | 1424456 | – | rna-gnl|WGS:QKKD|L226DRAFT_mRNA610475 | hypothetical protein | ||
| aga | Chr1047:1546379\T,\C | 5 | 1546379 | -0.0205141 | 5 | gene | 1546158 | 1550440 | + | rna-gnl|WGS:QKKD|L226DRAFT_mRNA531964 | RNA polymerase II-associated protein | |||||||||
| aga | Chr1056:290190\T,\C | 14 | 290190 | -0.0183155 | 14 | gene | 281852 | 293292 | – | rna-gnl|WGS:QKKD|L226DRAFT_mRNA613564 | hypothetical protein | |||||||||
| aga | Chr1056:301085\C,\T | 14 | 301085 | -0.028432977118 | 14 | gene | 301299 | 302875 | – | rna-gnl|WGS:QKKD|L226DRAFT_mRNA464361 | NAD(P)-binding protein | |||||||||
| aga | Chr1056:372057\A,\G | 14 | 372057 | -0.02773642 | 14 | gene | 370578 | 372984 | + | rna-gnl|WGS:QKKD|L226DRAFT_mRNA535672 | S-adenosyl-L-methionine-dependent methyltransferase | |||||||||
| aga | Chr1056:379782\G,\T | 14 | 379782 | -0.04061589 | ||||||||||||||||
| aga | Chr1056:577692\G,\A | 14 | 577692 | -0.02634238 | 14 | gene | 575623 | 579266 | + | rna-gnl|WGS:QKKD|L226DRAFT_mRNA535743 | hypothetical protein | |||||||||
| aga | Chr1056:657424\G,\A | 14 | 657424 | -0.02265925 | ||||||||||||||||
| aga | Chr1177:1001\T,\C | 135 | 1001 | -0.02463647 | 135 | gene | 1352 | 3889 | – | rna-gnl|WGS:QKKD|L226DRAFT_mRNA527722 | hypothetical protein | |||||||||
| sec | Chr1047:581962\C,\T | 5 | 581962 | 0.02195912 | 5 | gene | 581677 | 582232 | + | rna-gnl|WGS:QKKD|L226DRAFT_mRNA567930 | hypothetical protein | |||||||||
| sec | Chr1047:1533358\C,\T | 5 | 1533358 | 0.0174058 | ||||||||||||||||
| sec | Chr1101:124187\A,\G | 59 | 124187 | 0.01755269 | 59 | gene | 123327 | 124894 | – | rna-gnl|WGS:QKKD|L226DRAFT_mRNA473141 | hypothetical protein |
GWAS with Updated Genome
Past work on Lentinus tigrinus used the publicly available Lenti7 genome. The results in the poster above use the same Lenti7 genome. The four scaffolds associated with the agaricoid/secotioid morphology look like they fit together, but without a better genome assembly we cannot be sure. Our lab recently produced a new genome for Lentinus tigrinus using Illumina data for the Lenti6 genome and new Nanopore data from Lenti6. We mapped the GWAS results onto this new genome to produce the following plots:
Lenti6 BSLMM: Associated Genes
Six Bayesian sparse linear mixed model runs identified a collective 26 associated SNPs, mostly on scaffold 13 of the new Lenti6 genome and none of which were identified in the PCA analysis. The two known genes identified in this analysis were hexokinase and vacuolar protein sorting-associated protein 1.
| Run | SNP ID | SNP Scaff. | SNP Pos. | Effect | Downstream Gene Scaff. | Downstream Gene Type | Downstream Gene Start | Downstream Gene Stop | Downstream Gene Strand | Downstream Gene Phase | Downstream Gene ID | Downstream Gene Name | Upstream Gene Scaff. | Upstream Gene Type | Upstream Gene Start | Upstream Gene Stop | Upstream Gene Strand | Upstream Gene Phase | Upstream Gene ID | Upstream Gene Name |
|---|---|---|---|---|---|---|---|---|---|---|---|---|---|---|---|---|---|---|---|---|
| 0 | Chr104:1032336\T,\A | 4 | 1032336 | 0.0698733181312 | 4 | gene | 1032631 | 1033578 | – | FUN_005221-T1 | hypothetical protein | |||||||||
| 5 | Chr1013:688090\C,\T | 13 | 688090 | -0.2489215 | 13 | gene | 687692 | 689188 | – | FUN_010699-T1 | hypothetical protein | |||||||||
| 5 | Chr1013:696605\G,\A | 13 | 696605 | -0.2383887 | 13 | gene | 693661 | 696437 | + | FUN_010701-T1 | hypothetical protein | 13 | gene | 699007 | 700773 | – | FUN_010702-T1 | vacuolar protein sorting-associated protein 1 | ||
| 2 | Chr1013:696631\T,\G | 13 | 696631 | 0.3346923 | 13 | gene | 693661 | 696437 | + | FUN_010701-T1 | hypothetical protein | 13 | gene | 699007 | 700773 | – | FUN_010702-T1 | vacuolar protein sorting-associated protein 1 | ||
| 4 | Chr1013:696677\C,\G | 13 | 696677 | 0.203313200385 | 13 | gene | 693661 | 696437 | + | FUN_010701-T1 | hypothetical protein | 13 | gene | 699007 | 700773 | – | FUN_010702-T1 | vacuolar protein sorting-associated protein 1 | ||
| 4 | Chr1013:702665\T,\C | 13 | 702665 | 0.23511962228 | 13 | gene | 702068 | 702784 | – | FUN_010703-T1 | hypothetical protein | |||||||||
| 1 | Chr1013:708962\G,\C | 13 | 708962 | 0.1137285 | ||||||||||||||||
| 3 | Chr1013:712112\T,\C | 13 | 712112 | 0.2080436 | ||||||||||||||||
| 3 | Chr1013:759975\C,\G | 13 | 759975 | -0.2796142 | 13 | gene | 760036 | 761416 | – | FUN_010719-T1 | hypothetical protein | |||||||||
| 0 | Chr1013:767076\A,\C | 13 | 767076 | 0.487800357066 | 13 | gene | 766613 | 768561 | + | FUN_010722-T1 | hypothetical protein | |||||||||
| 1 | Chr1013:770510\G,\A | 13 | 770510 | 0.1488966 | 13 | gene | 768993 | 771310 | – | FUN_010723-T1 | hypothetical protein | |||||||||
| 1 | Chr1013:773674\G,\A | 13 | 773674 | 0.130354093192 | 13 | gene | 773584 | 774931 | – | FUN_010724-T1 | hypothetical protein | |||||||||
| 2 | Chr1013:823573\G,\C | 13 | 823573 | -0.2246705 | 13 | gene | 822010 | 824549 | + | FUN_010745-T1 | hypothetical protein | |||||||||
| 5 | Chr1013:828374\C,\G | 13 | 828374 | -0.1447514 | 13 | gene | 827711 | 828484 | – | FUN_010747-T1 | hypothetical protein | |||||||||
| 5 | Chr1013:828701\T,\C | 13 | 828701 | -0.1704084 | 13 | gene | 827711 | 828484 | – | FUN_010747-T1 | hypothetical protein | 13 | gene | 828798 | 829330 | – | FUN_010748-T1 | hypothetical protein | ||
| 4 | Chr1013:829242\C,\T | 13 | 829242 | 0.194681302877 | 13 | gene | 828798 | 829330 | – | FUN_010748-T1 | hypothetical protein | |||||||||
| 0 | Chr1013:834604\A,\C | 13 | 834604 | 0.202942721124 | 13 | gene | 834394 | 836452 | – | FUN_010751-T1 | hypothetical protein | |||||||||
| 3 | Chr1013:834604\A,\C | 13 | 834604 | 0.1226208 | 13 | gene | 834394 | 836452 | – | FUN_010751-T1 | hypothetical protein | |||||||||
| 0 | Chr1013:842534\G,\A | 13 | 842534 | -0.28680617856 | ||||||||||||||||
| 4 | Chr1013:848994\A,\G | 13 | 848994 | -0.252565932983 | 13 | gene | 846915 | 848958 | + | FUN_010756-T1 | hexokinase | |||||||||
| 1 | Chr1013:854661\A,\C | 13 | 854661 | -0.143584635222 | 13 | gene | 855217 | 856061 | + | FUN_010758-T1 | hypothetical protein | |||||||||
| 1 | Chr1013:854869\A,\C | 13 | 854869 | 0.1346482 | 13 | gene | 855217 | 856061 | + | FUN_010758-T1 | hypothetical protein | |||||||||
| 3 | Chr1013:862356\G,\A | 13 | 862356 | 0.1544015 | 13 | gene | 862003 | 862757 | – | FUN_010762-T1 | hypothetical protein | |||||||||
| 5 | Chr1013:862514\T,\C | 13 | 862514 | 0.1712555 | 13 | gene | 862003 | 862757 | – | FUN_010762-T1 | hypothetical protein | |||||||||
| 1 | Chr1013:865973\T,\C | 13 | 865973 | -0.1337842 | 13 | gene | 865503 | 867116 | + | FUN_010764-T1 | hypothetical protein | |||||||||
| 3 | Chr1013:870821\T,\C | 13 | 870821 | -0.1515588 | 13 | gene | 871143 | 874676 | + | FUN_010766-T1 | hypothetical protein |
Methods Details
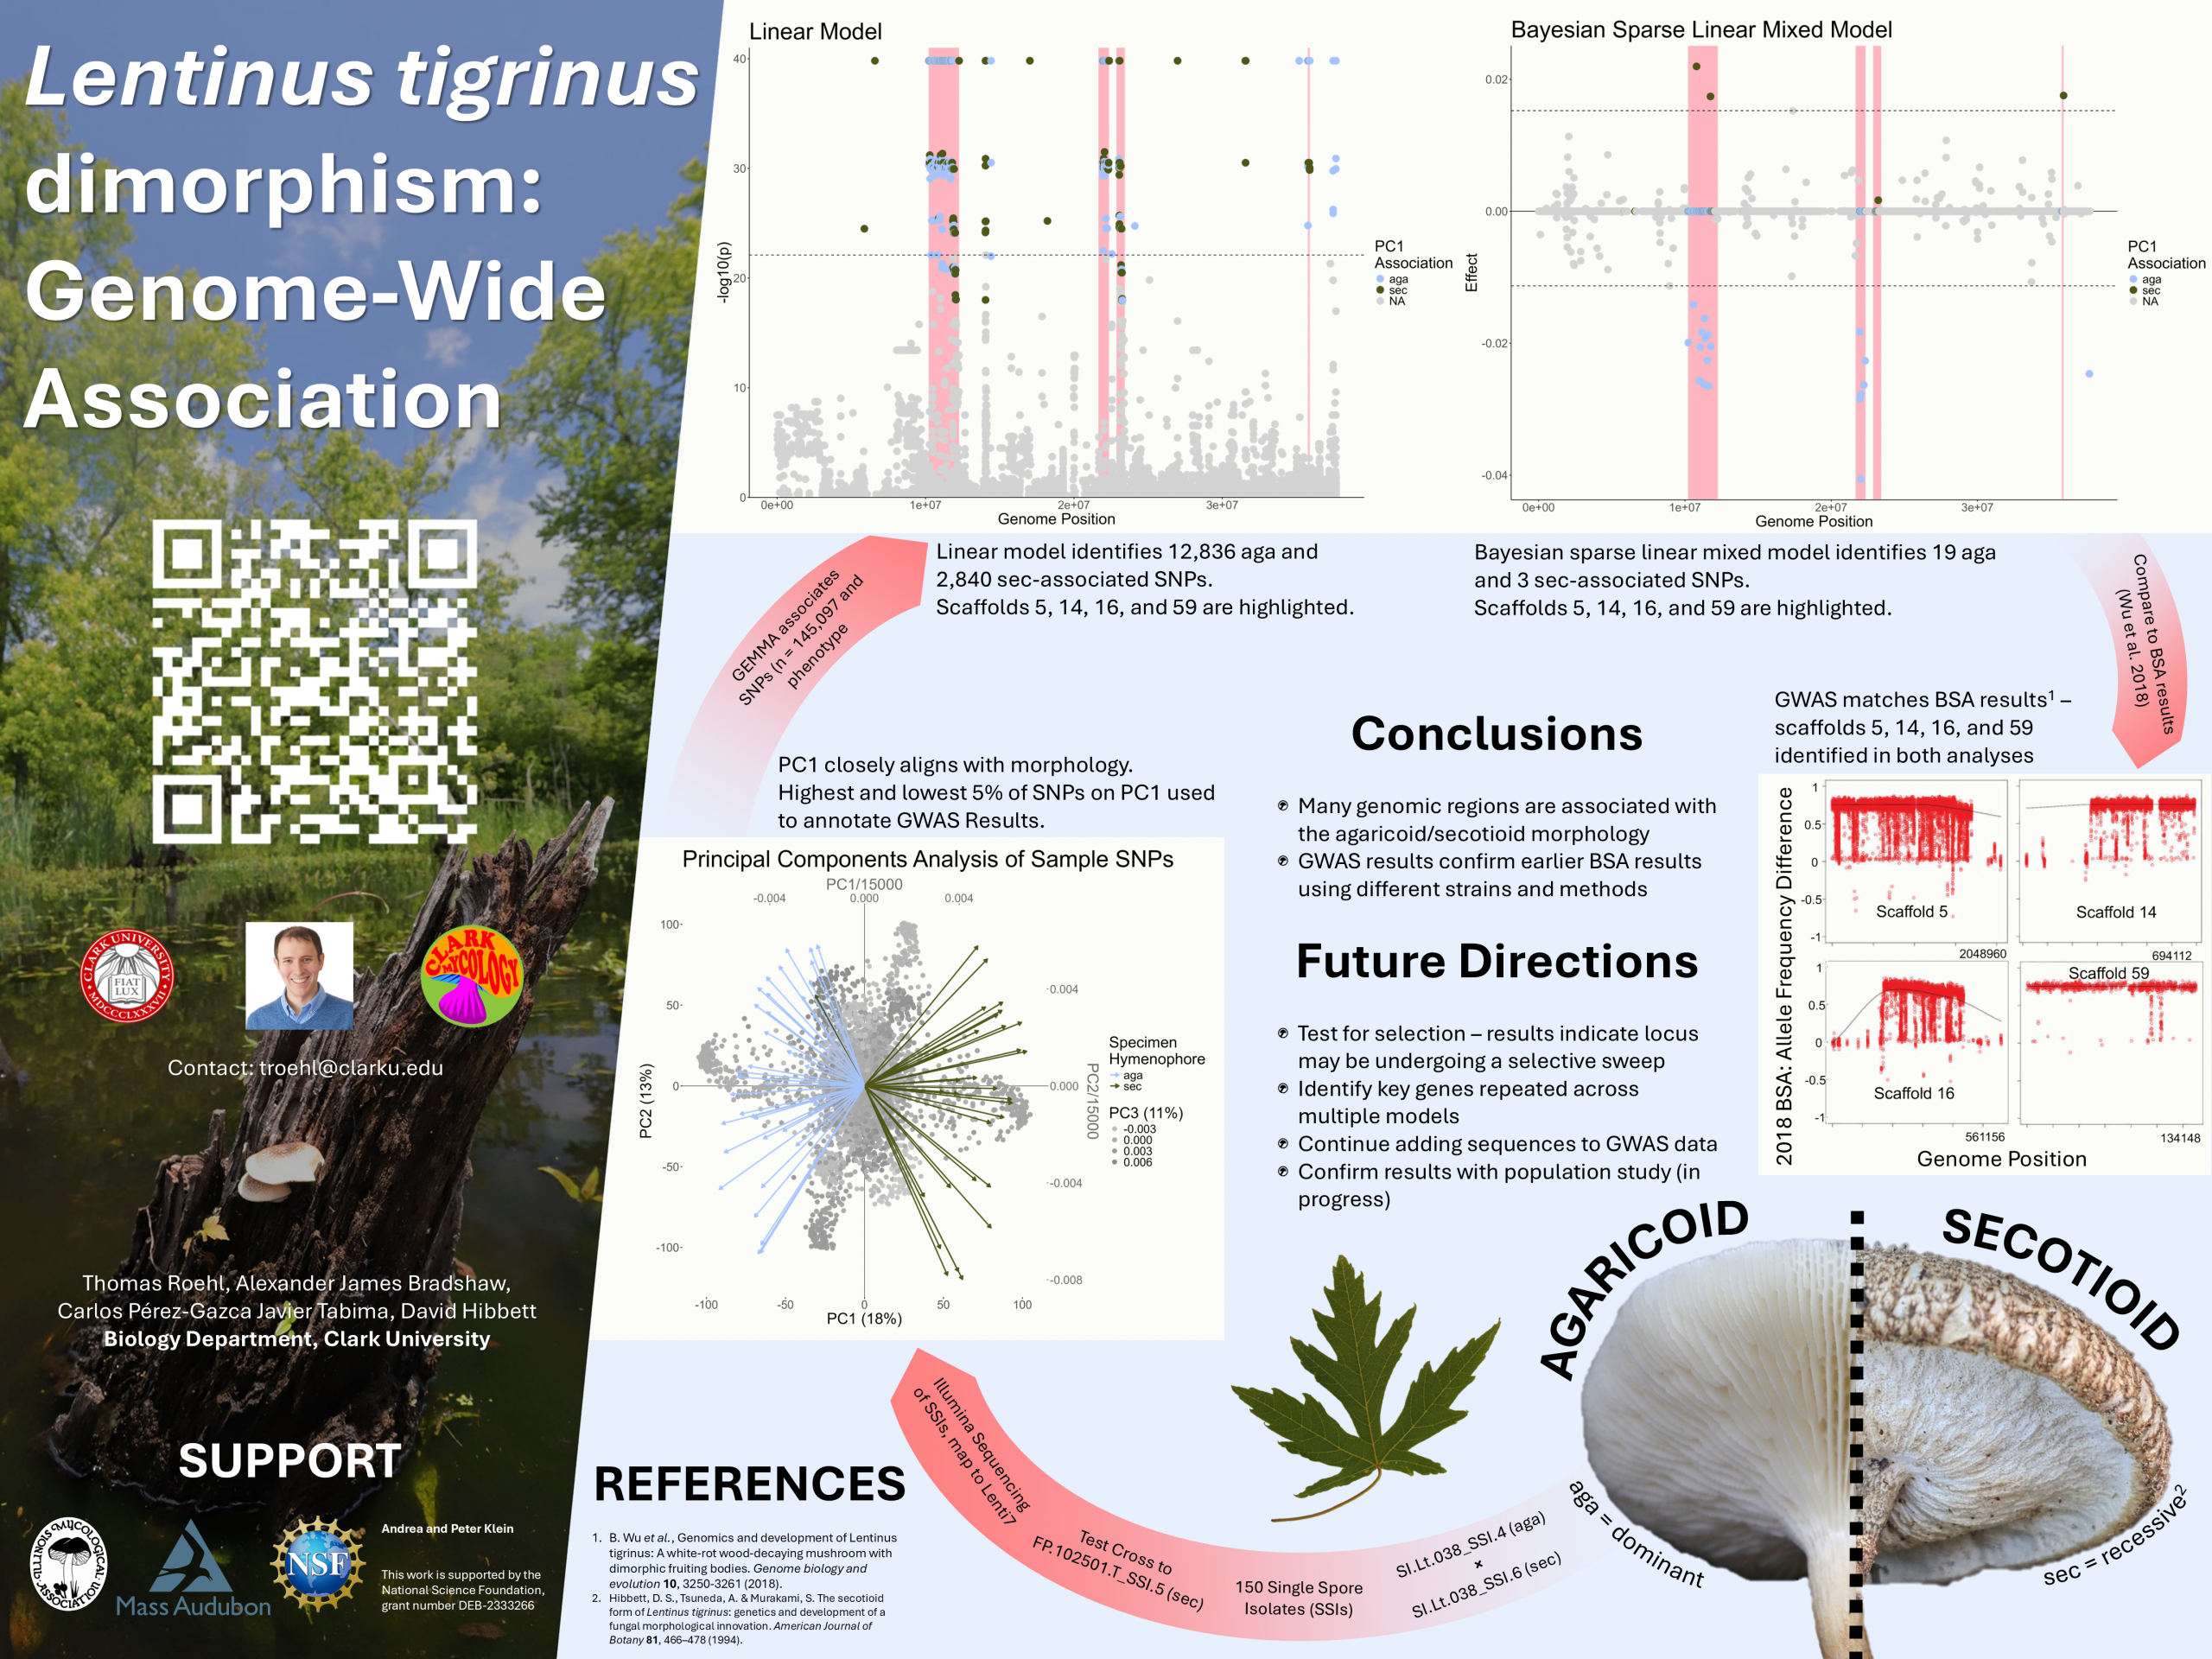
The specimen SI.Lt.038 (aga/sec) was collected from the Ipswich River (Topsfield, MA, USA) in June, 2023. Spores were isolated from that specimen and grown out as monokaryons. The monokaryons were then test crossed to the tester strain FP.102501.T_SSI.5 (sec) and mushrooms were grown from the resulting dikaryons. Hymenophore morphology of these test crosses was used to genotype the SI.Lt.038 single spore isolates (SSIs). Two SSIs – SI.Lt.038_SSI.4 (aga) and SI.Lt.038_SSI.6 (sec) – were crossed together to produce the GWAS parent. From this parent, 150 SSIs were produced. The GWAS SSIs were then test crossed to FP.102501.T_SSI.5 and genotyped by fruiting.
DNA was extracted using a standard SDS extraction protocol and was cleaned using a Zymo DNA Clean & Concentrator-5 kit. Illumina sequencing was performed by Novogene, Nanopore sequencing was performed in-house on an R10.4.1 flowcell using the Ligation Sequencing Kit v14. SNPs were aligned and called using the standard GATK4 variant calling pipeline.
A new Lenti6 genome was produced by hybrid assembly of Illumina and Nanopore data. Reads were trimmed and quality controlled using FastP. Nanopore long reads were basecalled using dorado and the Super Accurate “SUP” algorithm. Hybrid assembly was then performed using MaSuRCA with the CABOG assembler. Post assembly, genome polishing was performed with POLCA and homozygous scaffolds were collapsed using Redundands.
The genome-wide association was conducted with vcf2gwas, a pipeline which uses GEMMA to do the statistical analysis. Samples GWAS_SSI.060, 096, and 007 were removed from analysis until their hymenophore morphologies can be re-checked. The program was run using either the Lenti7 genome and annotations available on NCBI or the newly produced Lenti6 genome and annotations. We supplied principal components 2-6 as covariates, which covered a combined 49% of variation. Principal component 1 was not included because it strongly correlated to the phenotype of interest. To calculate significantly-associated SNPs, GEMMA was run using the linear model, linear mixed model, and Bayesian sparse linear mixed model. For the linear model and linear mixed model, SNPs were considered significant if they had a p-value lower than the lowest p-value of any SNP not identified in PCA analysis. For the Bayesian sparse linear mixed model, SNPs were considered significant if the effect size was higher than the highest or lower than the lowest SNP not identified by PCA analysis. In cases where the greatest effects were from non-PCA identified SNPs, significant SNPs were considered to be the ones greater or less than the most extreme PCA-identified SNPs. The linear mixed model produced results similar to the linear model, except without intermediately-significant SNPs and so for simplicity those results are not shown here. At least 6 runs of the Bayesian sparse linear mixed model were conducted – the ones shown here are the most representative results of those runs. Results were visualized using ggplot2 in the R statistical computing software version 4.4.1.